By Faouzi Aloulou, Jordan Young, Trinity Manning-Pickett
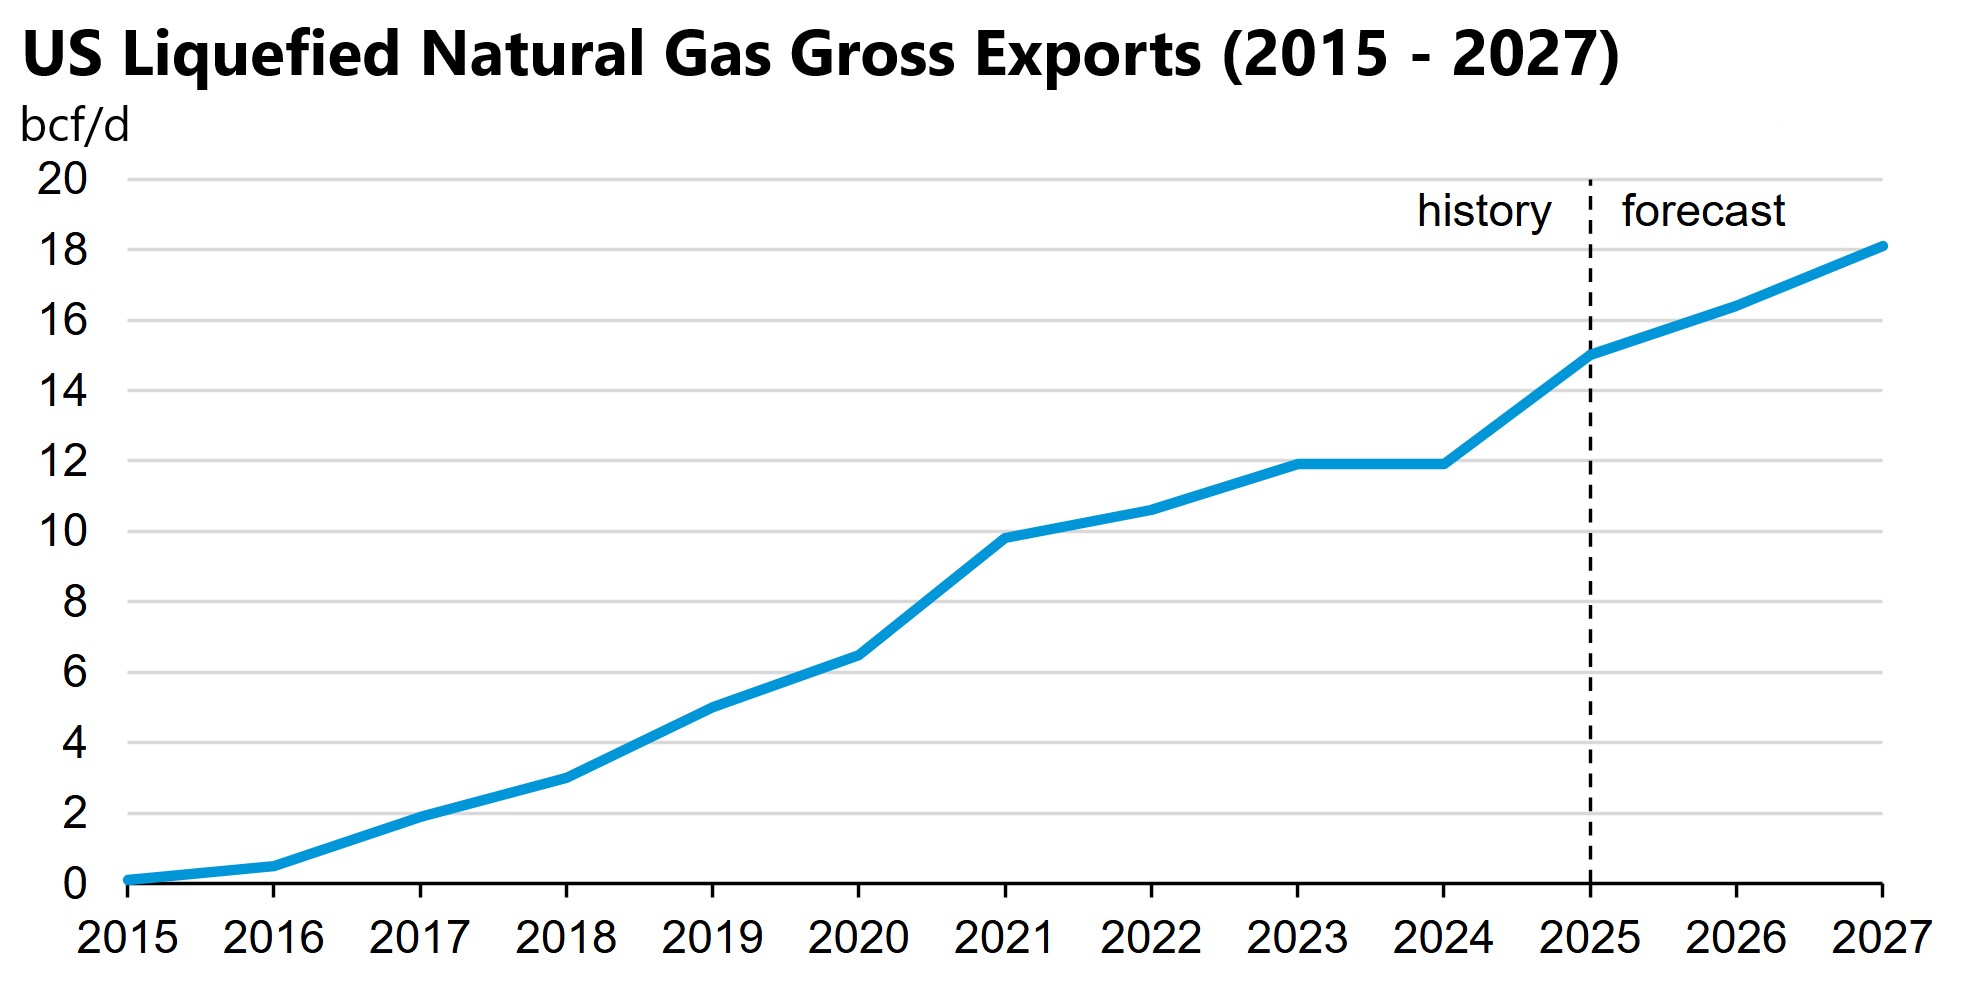
On February 24, 2016, the first liquefied natural gas (LNG) cargo from the Sabine Pass Terminal was exported from the United States, marking the beginning of a new era in US.LNG exports. Ten years later, the United States is the world’s largest LNG exporter, ahead of both Australia and Qatar. LNG exports surged from 0.5 bcf/d (14.1 x 10⁶ m3/d) in 2016 to 15 bcf/d (424.7 x 10⁶ m3/d) in 2025, and in its February Short-Term Energy Outlook, the US Energy Information Administration (EIA) forecast US LNG exports to exceed 18.1 bcf/d (512.5 x 10⁶ m3/d) in 2027. LNG exports from the United States increased for several reasons, including abundant natural gas supply and reserves, flexible LNG export contracts, and relatively low feedgas costs. In addition, increasing international demand and a favorable investment climate have supported LNG infrastructure expansions in the United States.
Prior to 2016, only small volumes of LNG were shipped from the United States. The first US LNG cargo crossed the Atlantic in 1959, but the trade proved uneconomical. Later, a small-capacity liquefaction terminal (about 0.2 bcf/d [5.6 x 10⁶ m3/d]) was built in Kenai, Alaska, which shipped about 1300 cargoes to Japan between 1969 and 2011.
Sabine Pass LNG Terminal in Louisiana, operated by Cheniere Energy, began operations as an import terminal in 2008. The rapid increase of oil and natural gas production from shale resources in the mid-2000s, however, curbed US LNG import demand and led terminal operators to convert some LNG import infrastructure into export infrastructure. On February 24, 2016, the first export cargo of the shale era departed aboard the Asia Vision for Brazil, carrying 3.3 bcf (93.4 x 10⁶ m3) of LNG. Since then, Sabine Pass has shipped over 3300 cargoes worldwide (39% of all US export cargoes through November 2025), according to the US Department of Energy’s LNG Exports and Re-Exports Details.
The United States has eight operational LNG export terminals, and by 2031 the EIA expects export capacity to nearly double compared with December 2025. Most recently, an expansion of the Corpus Christi LNG facility shipped its first cargo in March 2025, following the startup of the Plaquemines LNG facility in late December 2024, and Golden Pass LNG is expected to ship its first cargo in early 2026.

Note: The values for 2025 are based on a January through November average and do not include the EIA Short Term Energy Outlook forecast values for December 2025.
Before the war in Ukraine began in 2022, Asia received the most volumes of US LNG exports, averaging 46% from 2017 through 2021. Following Russia’s invasion of Ukraine, exports to Europe increased, and in 2022, Europe received 69% of all LNG exports from the United States, up from 34% in 2021. From January through November 2025, Europe received 68% of US-origin volumes.
Many other LNG-exporting nations most often use more rigid, Brent crude oil futures-indexed long-term contracts. In contrast, US contracts generally feature destination flexibility, allowing customers to redirect cargoes or resell access to terminal capacity if they do not want to take receipt of the natural gas. US contracts also often feature lower feedgas costs that are indexed to Henry Hub futures prices.
Customers, such as LNG marketers, utilities, and traders, generally buy US LNG on a free-on-board basis, in which the buyer pays an inflation-indexed liquefaction fee for liquefaction, storage, and loading services, plus feedgas costs when a vessel is loaded. Feedgas cost covers LNG plant fuel, pipeline loss, on-site power generation, and storage costs. A common estimate used in US LNG tolling agreements for feedgas costs is 115% of the Henry Hub futures price. For Brent crude oil-indexed pricing, contract terms are generally between 12% and 13% of the Brent crude oil futures price, depending on the duration of the contract. Under these common pricing agreements, the price of LNG from the United States is often less than LNG produced elsewhere.

About The Authors
Faouzi Aloulou, Jordan Young, Trinity Manning-Pickett are research analysts with the US Energy Information Administration